Scatterchat
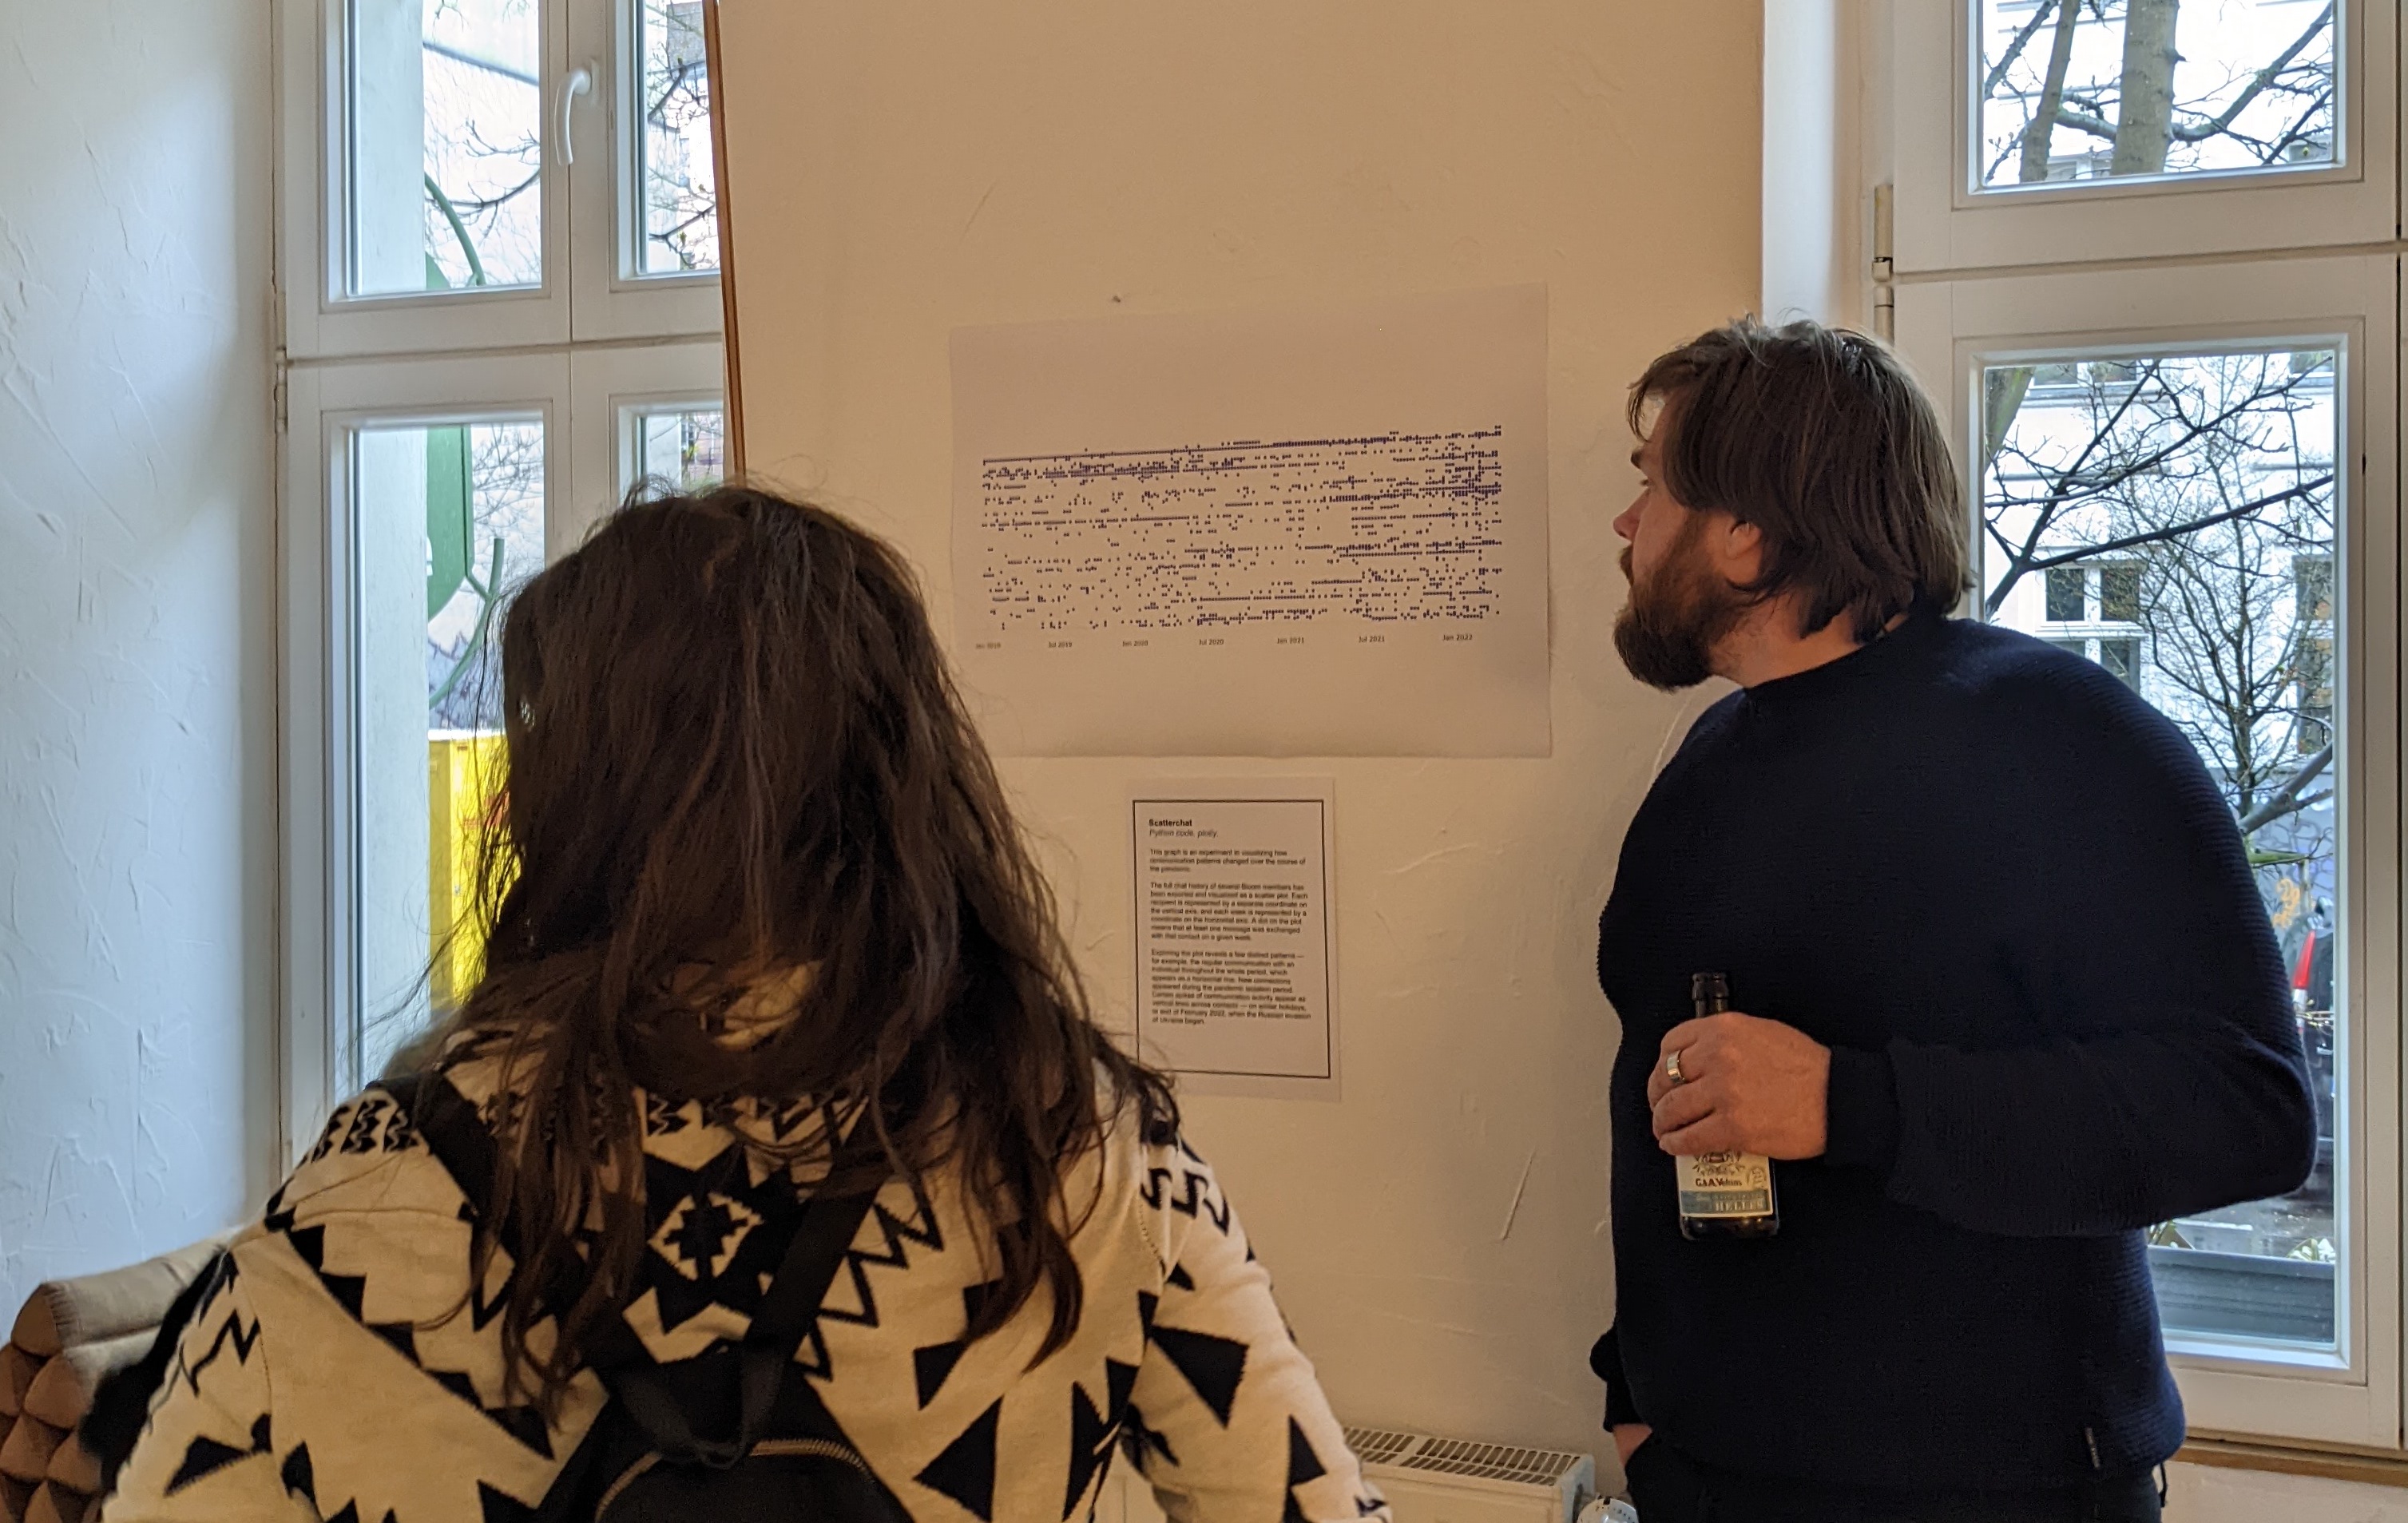
In April 2022 I was part of a maker retreat with Bloom Collective: a group of artists from UK, Europe and the US. We spent a week exploring the topics of pandemic isolation, belonging, and connection. At the end of the week we organized an exhibition in Berlin showing the six installations we created together. We called this Alone/Together.
Scatterchat was my small personal contribution to Alone/Together.
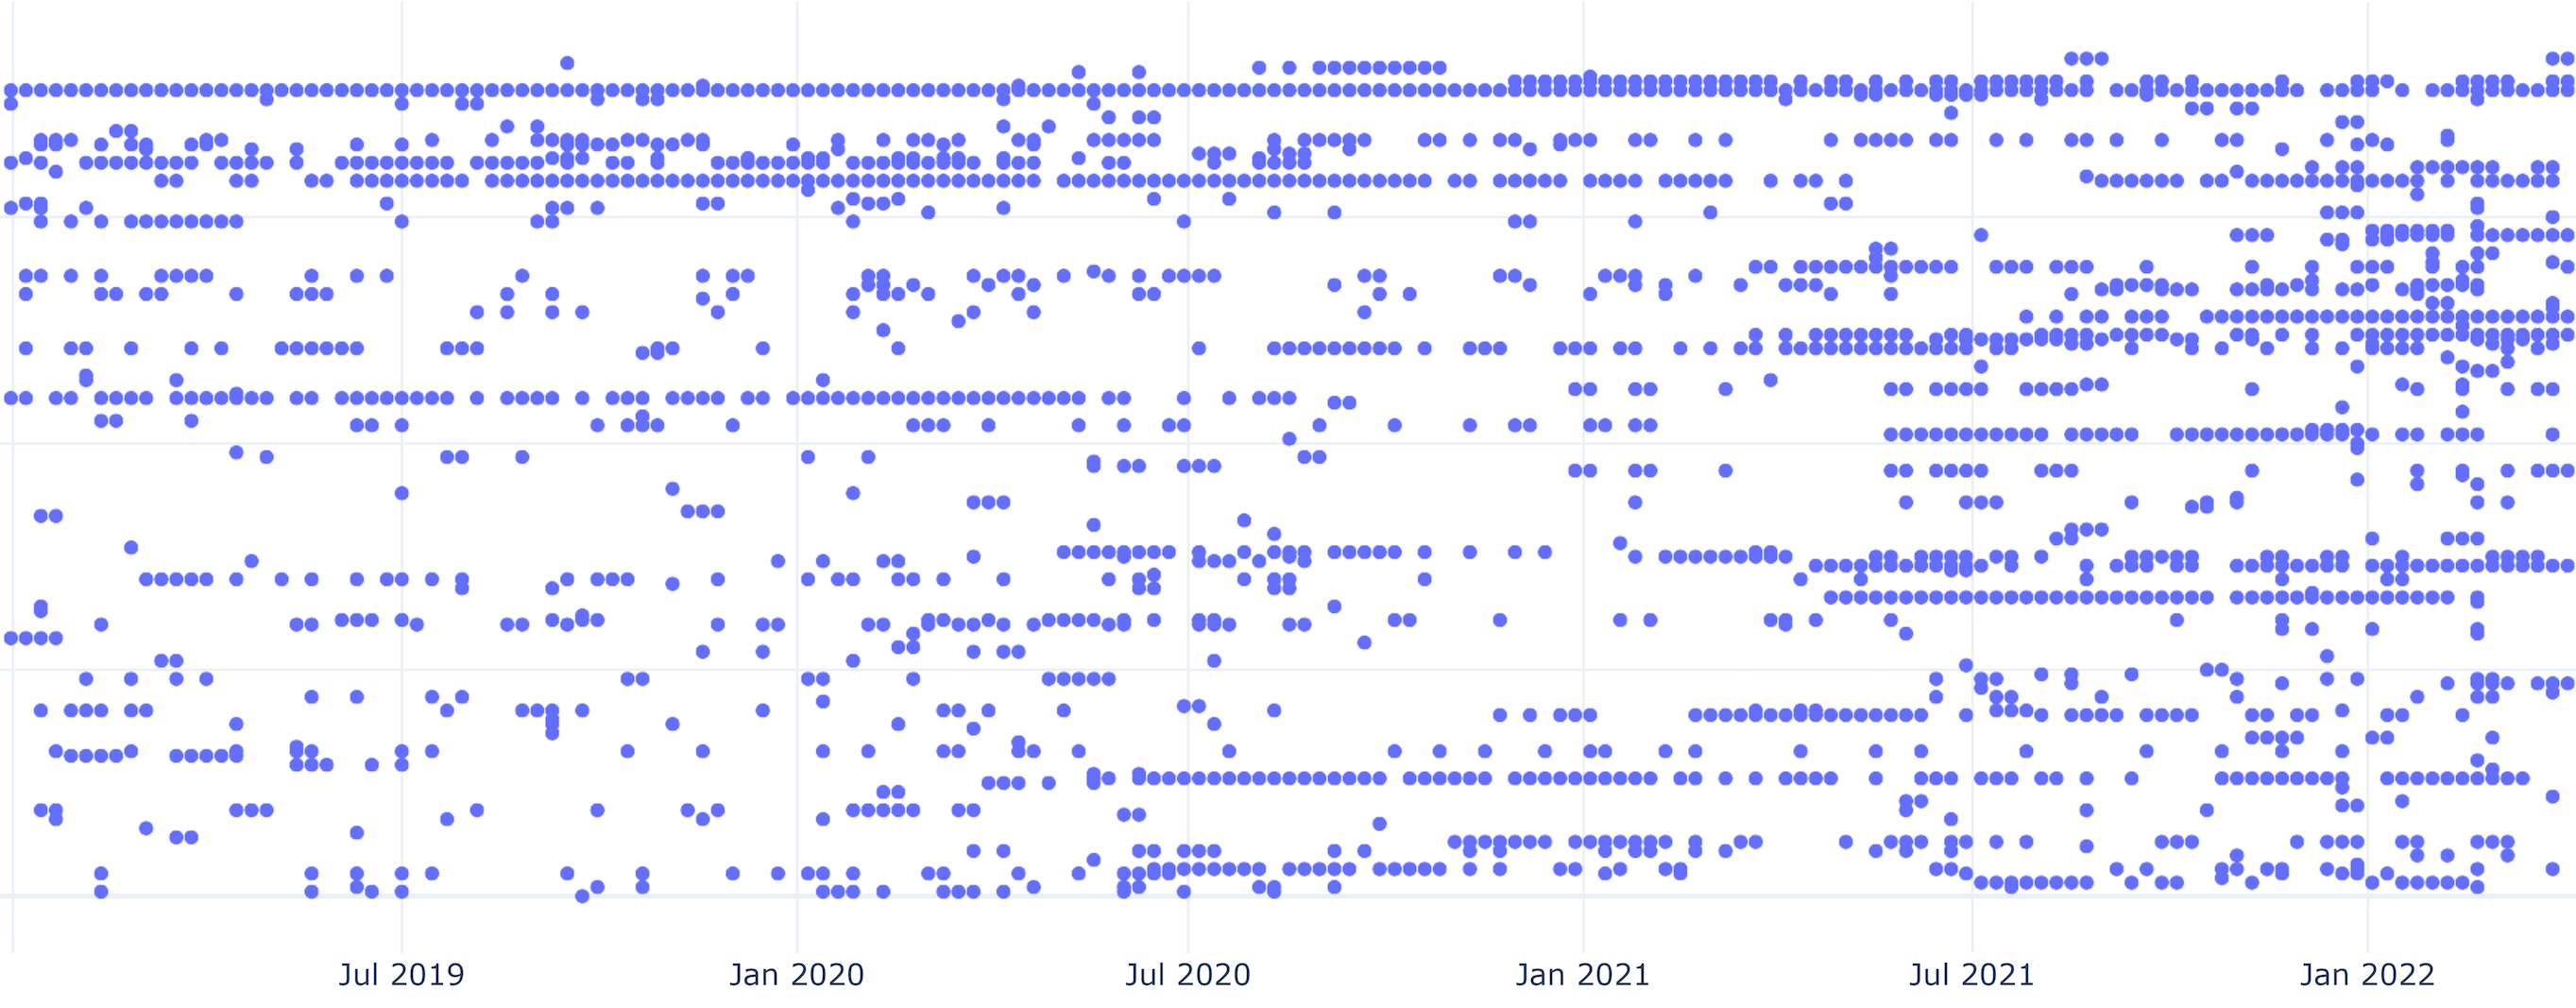
Python code, plotly.
This graph is an experiment in visualizing how communication patterns changed over the course of the pandemic. The full chat history of several Bloom members has been exported and visualized as a scatter plot. Each recipient is represented by a separate coordinate on the vertical axis, and each week is represented by a coordinate on the horizontal axis. A dot on the plot means that at least one message was exchanged with that contact on a given week.
Exploring the plot reveals a few distinct patterns — for example, the regular communication with an individual throughout the whole period, which appears as a horizontal line. New connections appeared during the pandemic isolation period. Certain spikes of communication activity appear as vertical lines across contacts — on winter holidays, or the end of February 2022, when the Russian invasion of Ukraine began.